Get crash reports from Sentry
We have been using Sentry for collecting crash reports and stack traces for our front-end js, Python, and Rails applications. It is reliable with affordable pricing. Simple to setup with it’s open-source SDK.
However, there’s a fundamental problem when it comes to iOS.
What? No symbolized data returned?
Sentry only returns the crash report with a piece of memory address but not a meaningful method name.
As an iOS developers, you should have noticed that it requires a dSYM file to symbolize the stack trace. It helps to identify these addresses with the appropriate dSYM file.
We thought we can upload dsym files and get symbolized information returned when Sentry claims it works on iOS.
Unfortunately, it is not the case:
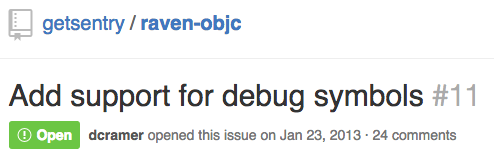
No one can understand the iOS Stack trace with memory address only. Proper support of dSym is needed.
(BTW if you can debug with memory address, please consider joining us.)
Solution
One of the possible solutions is to fork a piece of Sentry code and get our hands on it, but we don’t want to get into the complexity.
Instead, we write a micro service that will reply to a Sentry notification with de-symbolized stack trace on Slack, here is what we did.
A Slack bot to rule them all
Here we introduce a Slack bot that listens to Sentry notification and do all the de-symbolization works. Let us illustrate this with our iOS app Spentable.
- When a release is pushed to Testflight, it also pushes the respective dsym file to Slack.
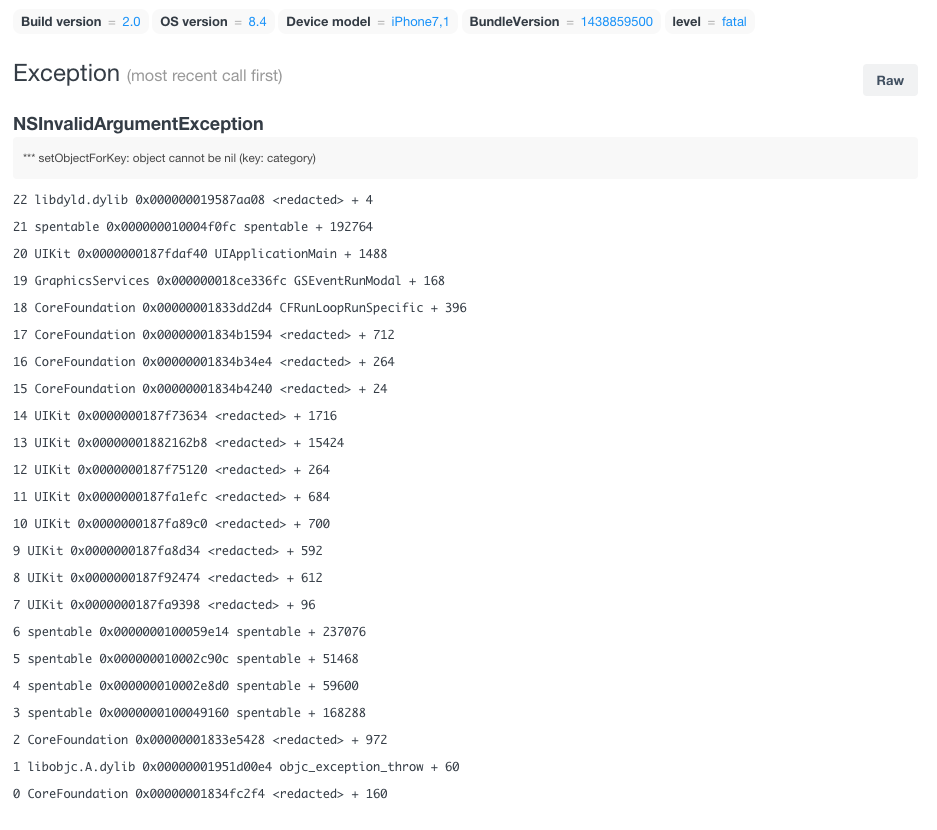
Raw exception from Sentry - When Sentry posts a notification to Slack, the bot will analyze the message.
- If the message is a stack trace, it will download the respective dSYM file and run a command to symbolize the stack trace.
- example stack trace:
18 spentable 0x000000010012aeb0 spentable + 192176 - runs the following:
loadAddress=`echo "obase=16;ibase=10;$((0x000000010012aeb0-192176))" | bc`atos -o -l $loadAddress 0x000000010012aeb0 -arch
- example result:
- (in spentable) (:)- if the corresponding dSYM file is not provided, result only shows the original de-symbolized trace:
0x000000010000003c (in spentable)
- if the corresponding dSYM file is not provided, result only shows the original de-symbolized trace:
- example stack trace:
- Result (NB: Only related stack trace) will be posted to corresponding Slack channel (in this case #spentable)
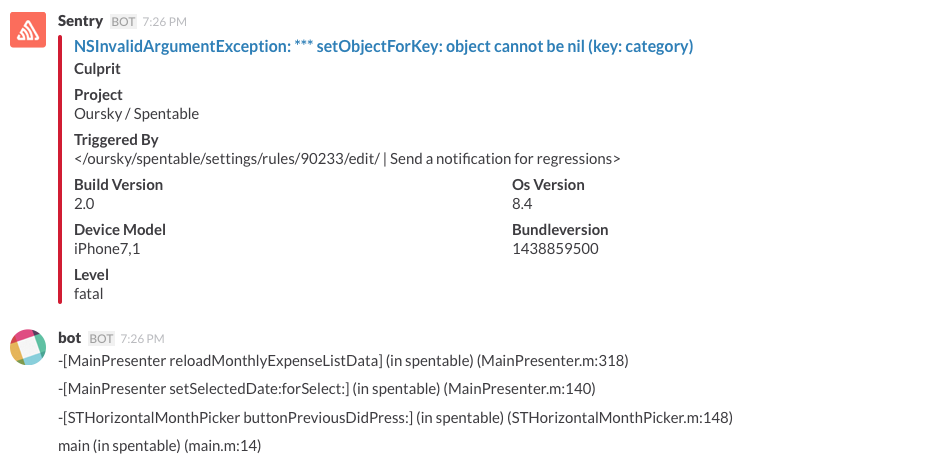
Now, the developers can start fighting with the bugs happily with this meaningful information 😉
Oursky had open-sourced this project on Github because we think it will be useful beyond Oursky. We are hoping that software programmers and developers will use, enhance, and customize this bot for their use-cases.
If you are interested in this mini Slack Bot, please check it out :
We would also like to engage with the community on topics related to efficiency for software development.
Tell us what you think and subscribe to our blog if you find this helpful.
Follow us on twitter to get updated.
